Credit Card Fraud Detection
Data Set Source
In 2019, the machine learning website Kaggle held a competition for ‘Kagglers’ to build a model that could detect fraudulent credit card transactions – IEEE-CIS Fraud Detection.
Towards the end of 2019, AIBMod was looking for a credit card fraud dataset with a large number of rows and features to test its neural transformer model against.
The team that won the competition used an ensemble approach (common in machine learning competitions) consisting of XGBOOST and CATBOOST – both of which are gradient boosted tree models.
The winning team also published a notebook detailing the feature engineering and set-up of the XGBOOST model that formed that part of the winning model.
From AIBMod’s perspective, this was an ideal opportunity to highlight any deficiencies in the neural transformer model as set out in the original paper and then develop with the target of beating the performance of the XGBOOST model.
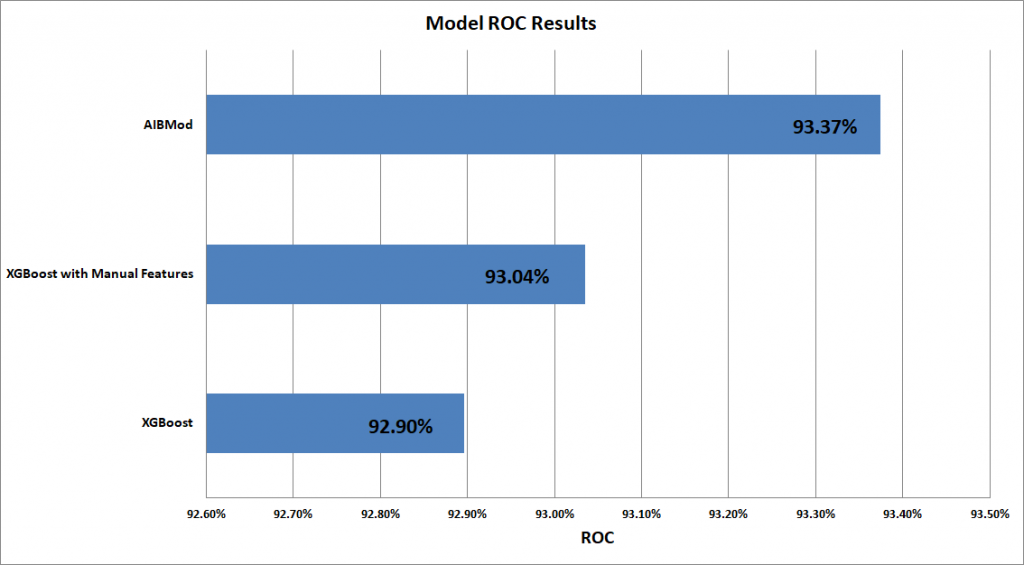
AIBMod vs XGBoost Results (ROC1)
AIBMod vs XGBoost Results (Logloss)
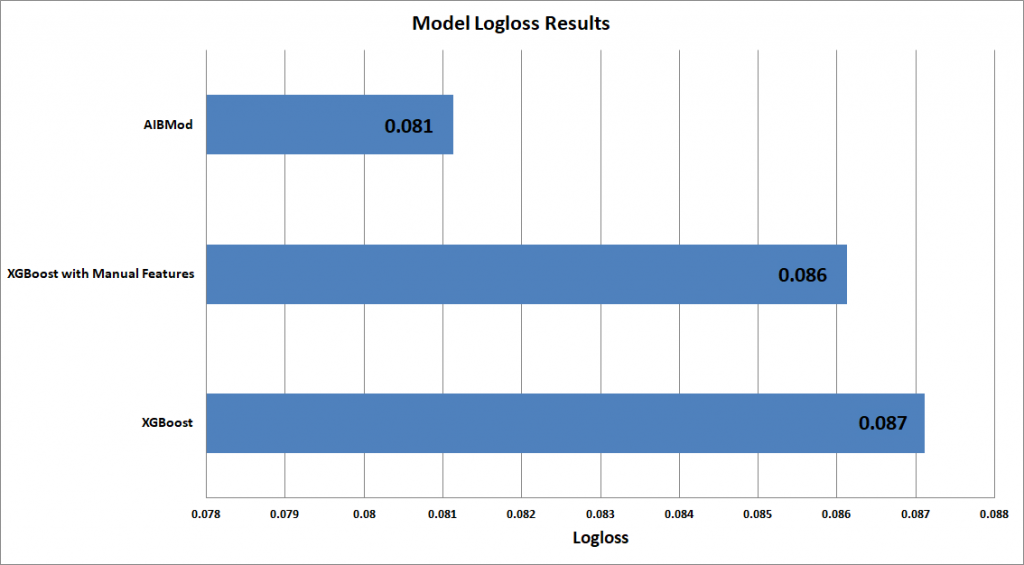
Table of Results Graphed Above
| Validation ROC | Validation Logloss | Expected Model Validation Class 1 Probability | Actual Validation Class 1 Probability | Actual Training Class 1 Probability | |
| AIBMod | 93.374% | 0.081133 | 3.454% | 3.454% | 3.514% |
| XGBoost | 92.896% | 0.087113 | 2.299% | 3.454% | 3.514% |
| XGBoost with Manual Features | 93.035% | 0.086127 | 2.278% | 3.454% | 3.514% |
With the expected Class 1 probability, closest to the actual Class 1 probability is best.
Bold indicates the best result for each metric.
Results Discussion
The graphs and the table above clearly show that the AIBMod model is able to beat both the ROC and Logloss scores of the XGBoost model.
It also shows that even with an additional 27 manually created features, the XGBoost model is unable to beat the AIBMod model results.
AIBMod noticed that the Class 1 expected loss from the XGBoost model seemed to be noticeably different from both the training and validation Class 1 expected loss. This contrasted with the good expected loss output from the AIBMod model. This could be because of the large amount of nan’s in the dataset and the way XGBoost deals with them. The AIBMod model can completely ignore the nan’s, meaning they don’t affect the predictions at all.
Dataset Composition
The dataset comprised 590,540 time ordered rows with credit card transactions. There was a second file which contained some more details about some, but not all, of the transactions from the first data file.
When these files are merged there are approximately 210 feature columns.
The training data comprised the first 75% of the data (442,905 rows) and the rest formed the validation data (147,635 rows). Hence the validation data had time stamps after the training data.
The Kaggle team eliminated some of the columns as not relevant and AIBMod, to keep things comparable, also dispensed with the same columns.
AIBMod also determined that a considerable number of the remaining columns, which mostly consisted of nan and zero values, added almost nothing to the XGBoost overall performance so those were also dropped from both models to facilitate a reduced scope of research.
After the above column removals, the dataset comprised of 35 categorical features and 28 numerical features – so 63 in total.
There were a large number of nan fields in the dataset and many categorical features had some values with a very low frequency. The model would need to be adept at dealing with these situations.
58 of the 63 features did not have a time element to them but five of them did. The Kaggle team performed a simple transformation to make the feature more time invariant – to make things comparable AIBMod used the same transform.
AIBMod believes that there could be a better way to handle these five features but that has been left for further research and could well form part of the future work on time series analysis.
The Manual Features version of the XGBoost model includes an additional 27 features created by handcrafting the original 63 – this makes a total of 90 features.
- ROC here means AUC ROC i.e. the area under the ROC curve ↩︎